FIXED ig-van-2014-top-colour i.e. a factor != a character
R is horrible :-) part 8888 :-) My previous Vancouver instagram 2014 top colour barplot graphic was wrong because I used an R ‘factor’ where I should have used an R ‘character’.
Key point:colours33=as.character(colours3)
Using colours3 as I was doing before caused the wrong colours to be used for the bars!
Full code:
sorted = read.csv(“/Users/rolandtanglao/Dropbox/PHOTOS/instagram-top10-vancouver-2014/sorted-ig-van-2014-top-colour-names.csv”)
counts3 = head(sorted[,2],200)
colours3 = head(sorted[,1],200)
colours33=as.character(colours3)
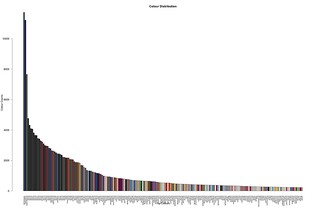
barplot(counts3, main=“Colour Distribution”, xlab=“Top Colours”,ylab=“Colour Counts”,names.arg=colours3,cex.names=0.6,col=colours33, space=c(0.2))