How to make the simplest possible literal colour as value piechart with a legend
Things to note:
- If you don’t need a legend see Simplest ggplot2 Pie Chart using colours as literal bar values.
- Changes from the legend-less version:
- in the aes() change TO
fill=colourFROMfill=I(colour) - add
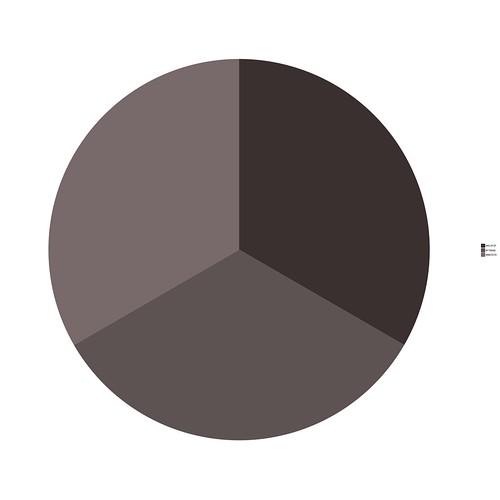
p = p + scale_fill_manual(values=c("#8B7D7D" = "#8B7D7D", "#4C3F3F" = "#4C3F3F", "#716666" = "#716666"))(i’m sure you can automate this colour=colour kludgery that i manully typed!)
- in the aes() change TO
The Code
The code is in scale-fill-manual-first3-ig-van01january2016-piechart.R.
library(ggplot2)
data3 = read.csv(
  file="01january2016-1st3datapoints.csv",
    stringsAsFactors=F)
p = ggplot(data=data3,
       aes(x=factor(1), fill=colour),)
p= p + geom_bar(stat="count", width=1)
p = p + coord_polar(theta="y", start=0)
p=p+theme_void()
p = p + scale_fill_manual(values=
c("#8B7D7D" = "#8B7D7D", "#4C3F3F" = "#4C3F3F",
"#716666" = "#716666"))

ggsave("scale-fill-manual-1st3-ig-van-01january-2016-piechart.png", p, width = 26.666666667, height = 26.666666667, dpi = 72, limitsize = FALSE)
And here’s what the pie chart with a legend looks like: