AES maps to levels which map to the default colour palette, geom SETS
Pontifications
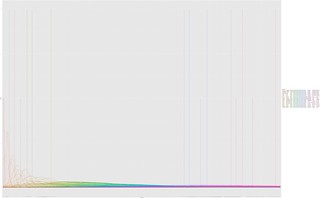
- As an aid to debugging the density plot with spikes of 1.0, I wanted to set the colours.
- I tried aes but that doesn’t work!
- AES maps but doesn’t SET part 8888 :-) the colour instead it maps the variable, in this case colourname, to a set of levels and the levels are mapped to a default colour palette i.e. the plot shows up not in the colours of colourname but in the default colour palette! Code:
ggplot(average_colour_ig_van_jan2016_colourname,
aes(colourname, colour=colourname)) + geom_density()
And here’s how it looks