Pontifications
- Not statistically valid :-) again :-)
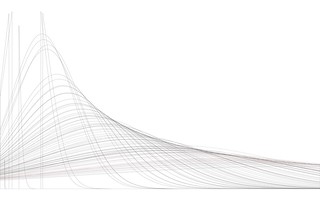
- I like this better than the previous blog post because it fills the graph
y axis scaled to 0.0012: R ggplot2 geom_density() Code:
library(tidyverse)
library(plotrix)

getnumericColour <-
  function(colorname) {
    colour_matrix=col2rgb(colorname)
    return(as.numeric(colour_matrix[1,1]) * 65536 +
             as.numeric(colour_matrix[2,1]) * 256 +
             as.numeric(colour_matrix[3,1]))
  }
csv_url =
"https://raw.githubusercontent.com/rtanglao/2016-r-rtgram/master/JANUARY2016/january2016-ig-van-avgcolour-id-mf-month-day-daynum-unixtime-hour-colourname.csv"
average_colour_ig_van_jan2016 = read_csv(csv_url)

# let's remove <= 5
gt5_h00_600colours <- average_colour_ig_van_jan2016 %>%
filter(hour=="00") %>%
add_count(colourname) %>%
filter(n >5) %>%
rowwise() %>%
mutate(sixhundred_colourint = getnumericColour(colourname))

# use hex colours
colour_hex_strings_all = sapply(gt5_h00_600colours$sixhundred_colourint, function(x){
  function(x){
    sprintf("#%6.6X", x)})

colour_named_vector <- setNames(as.character(colour_hex_strings_all), colour_hex_strings_all)

ggplot(gt5_h00_600colours, aes(x=colour))+
geom_density(mapping = aes(colour= colour_named_vector))+
scale_colour_manual(values=colour_named_vector)+
scale_y_continuous(limits = c(0,0.0012))
Output:
Leave a comment on github