Maps of Vancouver Neighourhoods average colour over plotted
Pontifications
- Bugs in Chinatown because of multiple woeids for Chinatown? That will be the next post :-)
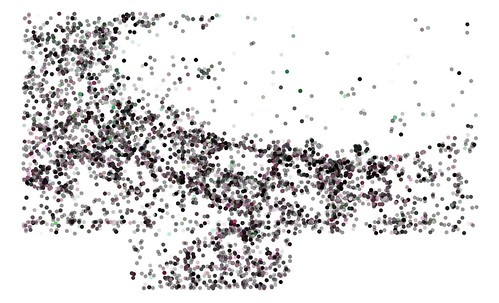
- 33 Maps of Vancouver Neighourhoods average colour over plotted (Gastown is the photo I chose for the set):
-
Here’s how I did it:
-
1. In R Studio:
setwd("/Users/rtanglao/Dropbox/GIT/ig-ggmap/WITH_NEIGHBOURHOOD_CSV_FILES_FOR_GGMAP_2015/CHROMELESS_MAPS_FOR_EACH_NEIGHBOURHOOD")
write.csv(filter_step2_ig_van_neighbourhood_2015,
          file = "filter_step2_ig_van_neighbourhood_2015.csv",
          row.names=FALSE)
- 2. from the command line, get the neighbourhoods and create a map for each:
tail -n +2 filter_step2_ig_van_neighbourhood_2015.csv |\
cut -d "," -f5 | sort | uniq -c | \
sort -rn > reverse_sorted_vancouver_neighbourhoods.txt
cp reverse_sorted_vancouver_neighbourhoods.txt \
only_real_vancouver-reverse-sortedwithout-counts.txt
vi !$ # remove non real vancouver neighbourhoods and the counts
cat only_real_vancouver-reverse-sortedwithout-counts.txt | \
parallel -N 1 \
Rscript ../../create-overplotted-Vancouver-neighbourhood-map.R {}