Fixed Chinatown by manually deleting 4 rows that were in NYC Chinatown
Pontifications
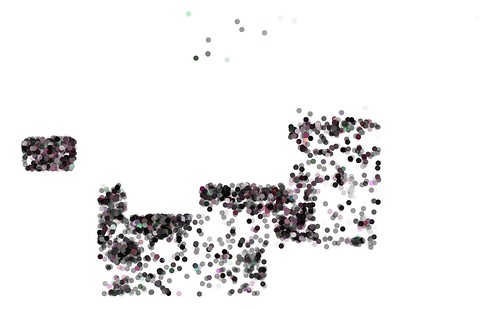
- 1. From the last post, Trying to fix Chinatown map that is only two points by removing outlier points that are in the Chinatown woeid that’s a subclass of Strathcona, I realized that I could just delete all the rows manually that were in NYC Chinatown. Turns out there were only 4 NYC Chinatown rows to delete!
- without_nyc_chinatown_ig_van2015.csv is with_outliers_chinatown_ig_van_2015.csv with latitude 40. i.e. nyc chinatown i.e. a total of 4 rows manually deleted,
- The output is: without_nyc_chinatown_ig_van_2015.png
Code
without_nyc_chinatown_ig_van_2015 =
  read.csv(file = "without_nyc_chinatown_ig_van2015.csv", stringsAsFactors = F)
ggplot(data=without_nyc_chinatown_ig_van_2015, aes(x=long, y = lat))+
  geom_point(aes(long,lat,color=I(without_nyc_chinatown_ig_van_2015$colour)),
             size=I(6.0),alpha=I(0.4))+
  theme_void()
Output