Pontifications
- use
group_by() and count() as in:
one_two_star_day <-
  one_and_two_star_with_date %>%
  group_by(date_updated) %>%
   count()
Full code
library(tidyverse)
reviews = read.csv("20april2018-01nov2017-18april2018-mongo-export-reviews.csv")
one_and_two_star_reviews = reviews %>%
filter(star_rating < 3)
one_and_two_star_with_date <- one_and_two_star_reviews %>%
mutate(date_updated = as.Date(review_last_updated_time))
one_two_star_day <-
one_and_two_star_with_date %>%
group_by(date_updated) %>%
count()
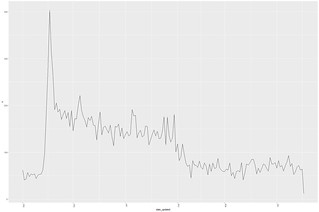
p = ggplot(
data =one_two_star_day,
aes(x=date_updated, y=n)) +
geom_line(stat = "identity")+
theme(axis.text.x = element_text(angle = 90, hjust = 1)) +
scale_fill_brewer(palette = "Set1")
Output
Leave a comment on github