Pontifications
# the following code was run in R Studio
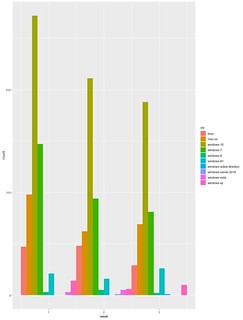
# and the output png from R Studio is here:
# https://github.com/rtanglao/rt-kitsune-api/blob/master/FF62_WEEK1_TO_3/operating-systems-ff62-desktop-first3weeks-5-25september2018.png
library(tidyverse)
week1_to_week3_os_tags <-
  read_csv(
    "https://raw.githubusercontent.com/rtanglao/rt-kitsune-api/master/FF62_WEEK1_TO_3/26september2018-week1-week3-weeknumber-tags.csv") %>%
  filter(
    grepl("^windows-", tag) |
    grepl("^mac-os", tag) |
    (tag == "linux")) %>%
  mutate(os=ifelse(grepl("^windows-", tag), "windows", tag))
week1_to_week3_os_tags <- week1_to_week3_os_tags %>%
  mutate(os=ifelse(grepl("^mac-os", tag), "mac-os", tag))
week1_to_week3_os_plot <-
  ggplot(data=week1_to_week3_os_tags, aes(x=week, fill=os))
week1_to_week3_os_plot = week1_to_week3_os_plot +
  geom_bar(stat="bin", bins = 3,
  position="dodge")
-
Here’s the output:

Leave a comment on github
