Simplest ggplot2 Bar Chart using colours as bar values
Things to note:
- It doesn’t seem to matter what you use for x in the aes statement ,
x=color,x=factor(1)both work - In
aes(x=colour, fill=I(colour))if you usefill=I(colour)i.e. use the literal colour values to colour the bar chart, then no legend is produced by ggplot2. If you need a legend, then usefill=colourin the AES to force a legend and addscale_fill_manual()to make a legend with the colours you want (see blog post on how to make literal colour pie charts with a legend). Not sure if this is a bug in ggplot2 or if there is an option to force a legend when using literal colour values. - In
p= p + geom_bar(stat="count")you needstat="countif you want ggplot to count the number of occurrences (in this case AFAICT all colours only appear once for most instagram vancouver vancouver 2016 photos for any particular hour!), i.e. your data is un-summarized. If your data is summarized then you can usestat="identity"
And here’s what the bar chart looks like:
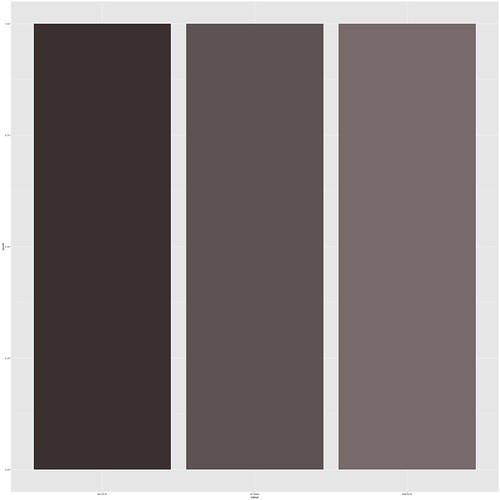
The Code
First the code,first3-ig-van-01january2016-barchart.R
library(ggplot2)
data3 = read.csv(file="01january2016-1st3datapoints.csv",
    stringsAsFactors=F)
p = ggplot(data=data3, aes(x=colour, fill=I(colour)))
p= p + geom_bar(stat="count")

ggsave("1st3-ig-van-01january-2016-barchart.png",
p, width = 26.666666667,
height = 26.666666667, dpi = 72, limitsize = FALSE)
The Data
Then the data, 01january2016-1st3datapoints.csv:
colour,id,dayofweek-month-dayofmonth,daynumber
#8B7D7D,1152722080165873450_545005592,FriJan1,1
#4C3F3F,1152722094194289757_285178194,FriJan1,1
#716666,1152722146880749719_340863,FriJan1,1