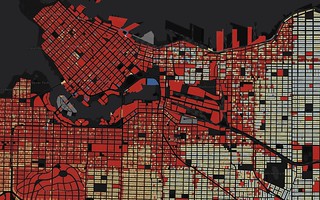
Tshirt from Jens von Bergmann's fab maps of Vancouver real estate tax assessment data
Pontifications
-
Jens tweeted:
First look at new assessment data: http://doodles.mountainmath.ca/blog/2017/01/16/2017-assessment-data/ … cc @VanOpenData - which was basically a map of the property values (done by BC Assessment) with dark red being $5 million or more (lighter reds are less money) and blue $500,000
- so naturally I thought of a T-shirt :-) !!!!!!!! of course!!!!
T-shirt graphic
- and here’s what i came up with (make vancouver on granville island and zazzle i’ll be visiting your websites soon :-))

Making of the T-shirt graphic
The above was made by surfing to:
- https://mountainmath.ca/map/values
- zooming to the area of Vancouver you wanted
- going to full screen
- and then in Firefox (I guess this is similar in Chrome?!? I don’t use Chrome except for bug reporting and testing!):
- 1.
Tools->Web Developer->Web Console - 2. next to the
>>type:$('.info').remove()and then clicking on the ‘x’ to make the developer tools invisible - 3. and then on the mac, screenshot entire browser window with the map as follows:
command shift 4,spacebar,click on the browser window with the map
- 1.