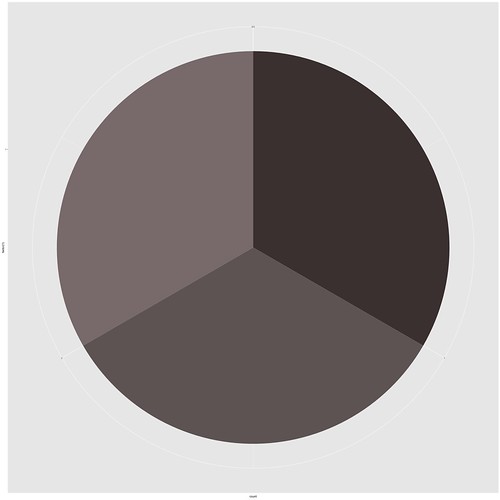
Simplest ggplot2 Pie Chart using colours as literal bar values
Things to note:
- There is a 1 line change to the previous blog post about the simplest possible bar chart to make the bar cart a pie chart. Just add:
p = p + coord_polar(theta="y", start=0). - This results in a legend-less pie chart. See How to make the simplest possible literal colour as value piechart with a legend.
And here’s what the pie chart looks like:
