Pontifications
- Part 1, Part 2, Part 3
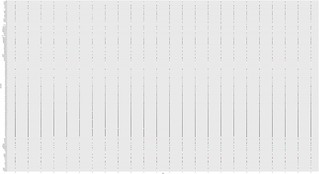
- First, here’s the output. The difference from part 3 is the dots are not all black but instead their actual colour, average colour, from the colourname column:
csv_url = "https://raw.githubusercontent.com/rtanglao/2016-r-rtgram/master/JANUARY2016/january2016-ig-van-avgcolour-id-mf-month-day-daynum-unixtime-hour-colourname.csv"
average_colour_ig_van_jan2016_colourname = read_csv(csv_url)
plot =
    ggplot(data=average_colour_ig_van_jan2016_colourname)+
geom_point(colour=average_colour_ig_van_jan2016_colourname$colourname, mapping = aes(x = hour, y=colourname))
- All the dots are now the correct colour!
- If you put the
colour=average_colour_ig_van_jan2016_colourname$colourname in the mapping = aes section instead of the geom_point section the colours will be mapped to levels and the actual color names won’t be used!
- This RScript was invoked as follows:
cd JANUARY2016
Rscript ../part4-create-colourname-with-colourname-aesthetic-scatterplot-hour.R
- In Part 5, we’ll try and create “art” :-) by adding
theme_void() and removing all chrome from the plot!
Leave a comment on github